Unified Structure Logging from Docker Containers to Elasticsearch with Fluent Bit
Message logging provides information about every event and error in your applications, making is essential for troubleshooting. Application frameworks include this functionality as a built-in component.

By default, Docker uses the
json-file logging driver.
It writes logs in files using JSON format, and rotates these files based on logging options.
Each container has its own log files, allowing you to use the docker logs command to
read them. However, reading container logs directly on the Docker host each time you need to
debug a failure is more difficult than expected. Because log lines cannot be easily searched,
they remain in chronological order, similar to the output in your terminal.
Furthermore, large log files could potentially overwhelm your terminal
unless you specify time range options. Due to these two problems, we need to figure out
a way to effectively view, search, and filter logs produced by docker containers.
Docker supports the fluentd logging driver, which can send container logs to Fluent Bit collector as structured data. With Fluent Bit, you can use its pipeline to transform logs. For example, you can extract attributes from a log message or change log fields. After they are processed, send logs to Elasticsearch data streams, which are optimized for storing append-only time series data.
1. Setting up Docker and Fluent Bit
Follow the fluentd logging driver
docs to use fluentd driver as the default logging driver.
The input plugin forward is used route messages between Fluent Bit and Fluentd,
below add a input to Fluent Bit that listen on all interfaces 0.0.0.0:2422.
...
[INPUT]
    name            forward
    listen          0.0.0.0
    port            2422
    storage.type    filesystem
... |
2. Transforming logs with Fluent Bit
Logs come from Docker is structured data with 4 fields, its internal representation is will be:
[1540936693, {"container_id"=>"c4c37ef6b231",
  "container_name"=>"/abc",
  "source"=>"stdout",
"log"=>"log message line"}] |
From this point, you can process Docker container log streams with Fluent Bit. A log message may contain much information. For example, Nginx access logs contain an IP, method, URI, response code, and more. Java application logs usually contain thread ID, class name, and line number where the event occurs. But whatever logs are produced by whatever application, they share three common fields: the time it occurs, the error level it belongs to, and the message it tells. With these three common fields, you can define a general structure:
[1540936693, {"host"=>"abc",
  "level"=>10,
"message"=>"log message line"}] |
When you run a container, you may pass a container name to reflect the server
on which it runs. The container_name field is then renamed to host. The field
level is extracted from the log line. The message field should be the remainder
after subtracting time and level parts from the log line.
2.1. Modify logs to conform to the general structure
Using the Modify Filter plugin:
Removing unwanted fields.
Adding new fields.
[FILTER]
    name    modify
    match   docker-logs*
    remove  container_id
    remove  source
    rename  container_name  host
    rename  log             message
    # TRACE 5, DEBUG 10, INFO 20, WARN 30, ERROR 40
    add     level           20
add tie_breaker_id 0 |
Make sure the filter matches your container. Pass the option --log-opt,
using the docker-logs tag prefix, to your container.
docker run --name nginx.testing --log-opt tag=docker-logs-nginx ... |
Using custom Lua scripts to extract time and level information from log messages. If this information is not present, level defaults to 10 (INFO), and time remains unchanged.
[FILTER]
    name    lua
    match   docker-logs*
    script  filter.lua
call modify |
Implement information retrieval logic in filter.lua with a public function named
modify. Below are log lines from common known applications:
nginx, with log option tag=docker-logs-nginx.
172.31.6.132 - - [19/Nov/2025:10:10:00 +0000] "GET /favicon.ico HTTP/1.1" ... 2025/11/19 16:33:04 [error] 2586997#2586997: *2797824 upstream prematurely ... |
Java, with log option tag=docker-logs-java.
[2025-11-19 10:35:04,019] TRACE [Controller id=1] Leader imbalance ratio ... |
Redis, with log option tag=docker-logs-redis.
1:M 19 Nov 2025 10:40:41.184 * Background saving terminated with success |
Golang, with log option tag=docker-logs-go.
2025-11-14T07:21:10.003Z INFO livekit service/server.go:211 ... |
Extracting information from various log formats in a single Lua script requires careful tunning. It is best to keep the script small and fast. While your first instinct might be to use regular expressions, Lua does not fully support them. Instead, Lua uses its own pattern matching engine, which includes features that handle cases difficult for standard POSIX regular expressions to match.
filter.lua
(source)
is a small Lua script that implements time and level information matching.
Feel free to tweak it for your convenience, but don’t foget to run tests before
deploying to production.
3. Centralizing logs
You may have noticed an unused field in previous section, named tie_breaker_id
that is added by Modify Filter configuration. This field initialized to 0, then
calculated in filter.lua. Because we are shipping logs to ES, this field served
as a tie-breaker when query to logs with the search_after parameter. Allows infinite
scroll and effecient pagination.
If many many logs occur at the same second, a tie-breaker is used as an alternative sort field to handle pagination (loading the next page).
3.1. Send logs to Elasticsearch data streams
Use the es output plugin to ingest logs into Elasticsearch.
...
[OUTPUT]
    name            es
    match           docker-logs*
    host            127.0.0.1
    port            9200
    http_user       elastic
    http_passwd     password
    index           docker-logs
    Suppress_Type_Name On
    tls             On
    tls.ca_file     http_ca.crt
... |
Elasticsearch 8.0.0 or higher no longer supports mapping types,
and set Suppress_Type_Name to On.
docker-logs functions as a data stream. Refer to the
Data streams
documentation to learn how to configure it in Elasticsearch.
The backing index template for this data stream
should be configured with the following mappings, though you should tweak
the mapping parameters to suit your specific data.
{ "mappings": { "_data_stream_timestamp": { "enabled": true }, "properties": { "@timestamp": { "type": "date", "format": "strict_date_optional_time", "ignore_malformed": false }, "host": { "type": "keyword" }, "level": { "type": "byte" }, "message": { "type": "text", "index_options": "offsets" }, "tie_breaker_id": { "type": "integer", "ignore_malformed": false, "coerce": true } } } } |
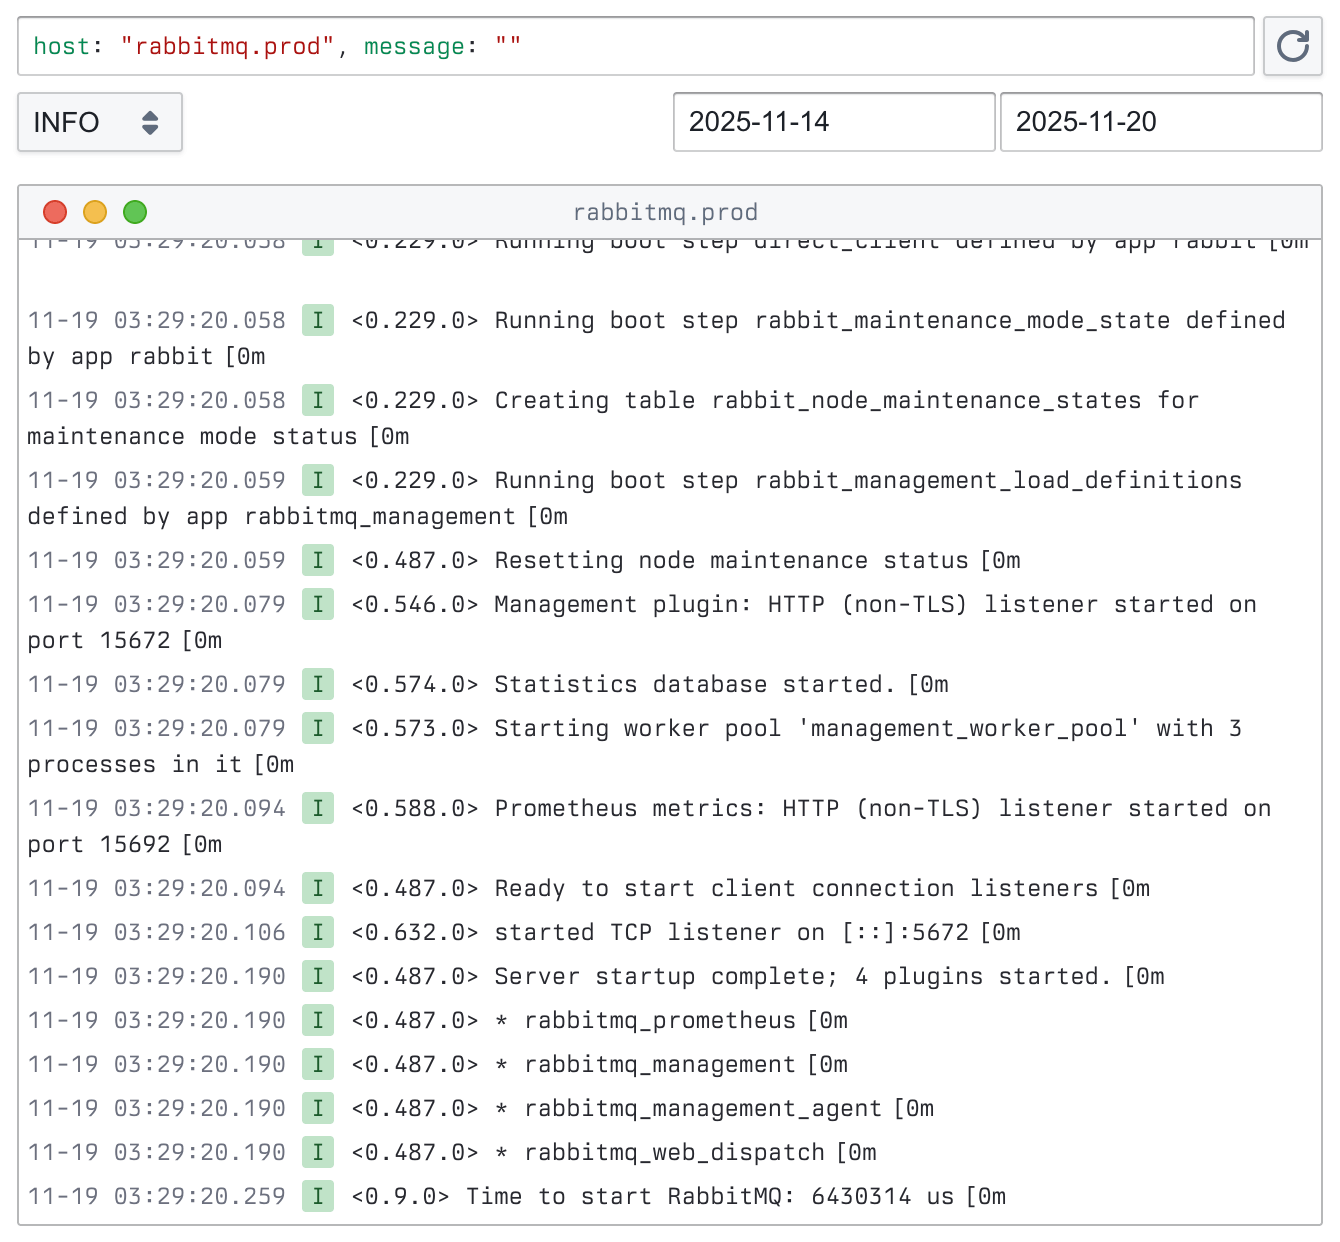
3.2. Explore logs as they are in the terminal
After logs are indexed, you can query them in Kibana Observability. Since logs are well-structured, it’s easy to build a custom log explorer (Figure 2).
4. Further thoughts
If you need detailed log for specific service, such as Nginx, you can use Fluent Bit to parse and transform raw log lines. You should also configure a data stream in your Elasticsearch service to match your log structure. Fluent Bit is a versatile tool capable of processing all kinds of logs and metrics data.